Contracts for Difference (CFDs) have become a popular trading instrument due to their flexibility and the ability to profit from both rising and falling markets. Central to successful CFD trading is the use of technical analysis, a method that relies on chart patterns and technical indicators to forecast future price movements. This article explores how traders can leverage charts and technical analysis to enhance their CFD trading strategies, providing a comprehensive guide to interpreting charts, understanding key indicators, and implementing effective trading strategies.
Understanding Technical Analysis
Technical analysis is the study of past market data, primarily price and volume, to forecast future price movements. Unlike fundamental analysis, which examines economic and financial factors, technical analysis focuses on price patterns and trends to make trading decisions. This method assumes that all relevant information is already reflected in the price and that historical price movements can help predict future trends.
The significance of technical analysis in CFD trading lies in its ability to identify trading opportunities and make informed decisions based on statistical data. By analysing chart patterns and technical indicators, traders can gain insights into market sentiment, spot potential entry and exit points, and manage their trades more effectively. Check out ADSS trading for more information.
Types of Charts Used in CFD Trading
Charts are the primary tool for technical analysis, and understanding different types of charts can greatly enhance a trader’s ability to interpret market data. Line charts are the simplest form of chart, depicting the closing prices over a specified period. They provide a clear view of the overall trend but lack the detail of price fluctuations within each period. While useful for identifying general trends, line charts may not offer the detailed analysis needed for more nuanced trading decisions.
Bar charts present more information than line charts by displaying each period’s open, high, low, and close prices. Each bar represents a specific time frame, such as a day or hour, and provides a visual representation of price movements within that period. Bar charts help understand market volatility and the range of price movements.
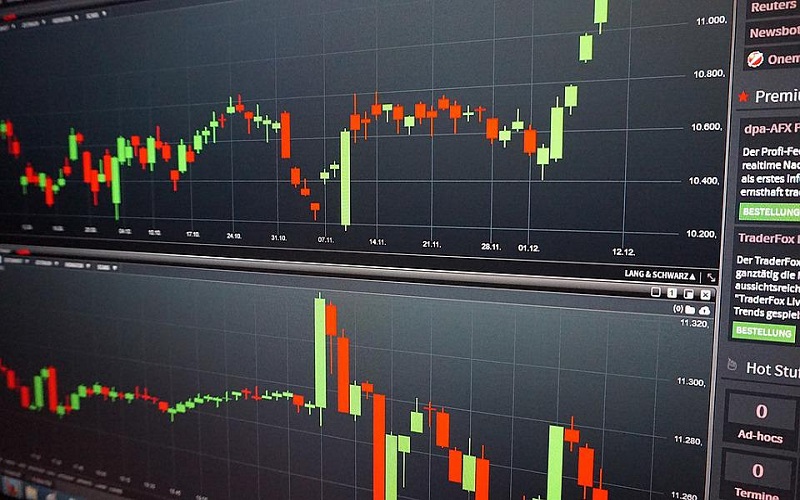
Candlestick charts are a popular choice among traders due to their ability to convey detailed information about price action. Each candlestick shows the open, high, low, and close prices, with the body of the candlestick representing the range between the open and close. The colour and shape of the candlestick provide insights into market sentiment and potential reversal points. Patterns such as doji, hammer, and engulfing can signal market reversals and are crucial for making trading decisions.
Chart Patterns and Their Significance
Chart patterns are formations created by the price movements of a security. Recognizing these patterns can help traders predict future price movements and make informed trading decisions. Trend patterns indicate the general direction of the market. Uptrends are characterised by higher highs and higher lows, while downtrends exhibit lower highs and lower lows. Sideways trends, or range-bound markets, occur when prices move within a horizontal range. Trendlines and channels can help traders visualise and trade these trends by identifying support and resistance levels.
Reversal patterns signal a potential change in the direction of the market. Head and shoulders, double tops, and double bottoms are common reversal patterns. A head and shoulders pattern consists of three peaks: a higher peak (head) between two lower peaks (shoulders). A double top is formed after an uptrend and signals a potential bearish reversal, while a double bottom indicates a potential bullish reversal after a downtrend.
Continuation patterns suggest that a trend is likely to continue after a brief consolidation period. Flags, pennants, and wedges are examples of continuation patterns. Flags and pennants form after strong price movements and indicate a temporary pause before the trend resumes. Wedges, which can be rising or falling, signal a potential reversal or continuation of the trend depending on their formation.
Practical Tips for Effective Chart Analysis
Choosing the right time frames is crucial for aligning chart analysis with trading goals. Shorter time frames, such as 5-minute or 15-minute charts, may be suitable for day trading and capturing short-term price movements. Longer time frames, such as daily or weekly charts, are better suited for swing trading and identifying broader trends. Selecting the appropriate time frame helps traders make more informed decisions and manage their trades effectively.
Continuous learning and adaptation are essential for staying current with new technical tools and strategies. The financial markets are dynamic, and traders need to update their skills and knowledge regularly. Reviewing past trades, analyzing performance, and learning from both successes and failures can help traders refine their technical analysis skills and improve their trading strategies.
Using trading platforms effectively can enhance chart analysis and trading efficiency. Many trading platforms offer advanced charting tools and customization options, allowing traders to tailor their charts and indicators to their preferences. Familiarizing oneself with the features of a trading platform and utilizing its capabilities can provide a competitive edge in CFD trading.
Conclusion
Technical analysis is a powerful tool for CFD traders, offering insights into market trends, price movements, and potential trading opportunities. By mastering various chart types, technical indicators, and trading strategies, traders can gain a significant advantage in the market. Effective chart analysis, combined with sound risk management and continuous learning, can lead to more informed trading decisions and improved trading performance.


